- Documentation (2.6.0-local-20230820130639)
- Release Notes
- Tutorials
- Reference
- Introduction
- System Properties
- Settings Files
- Ivy Files
- Ant Tasks
- artifactproperty
- artifactreport
- buildlist
- buildnumber
- buildobr
- cachefileset
- cachepath
- checkdepsupdate
- cleancache
- configure
- convertmanifest
- convertpom
- deliver
- dependencytree
- findrevision
- fixdeps
- info
- install
- listmodules
- makepom
- post resolve tasks
- publish
- report
- repreport
- resolve
- resources
- retrieve
- settings
- var
- Using standalone
- OSGi
- Developer doc
Using yEd to layout report graphs
yEd is a free graph editor, benefiting from all the automatic layouts of yFiles. Ivy is able to generate graphs which are readable by yEd.
The graphs generated by Ivy are not laid out (in fact, it’s why we use yEd), so you have to follow a simple sequence of steps to layout the generated graphs.
Preparation
First you have to generate a GraphML file. Simply call the report task (see Ivy use documentation) for that.
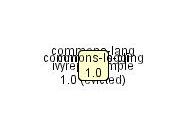
Step 1: open the GraphML file
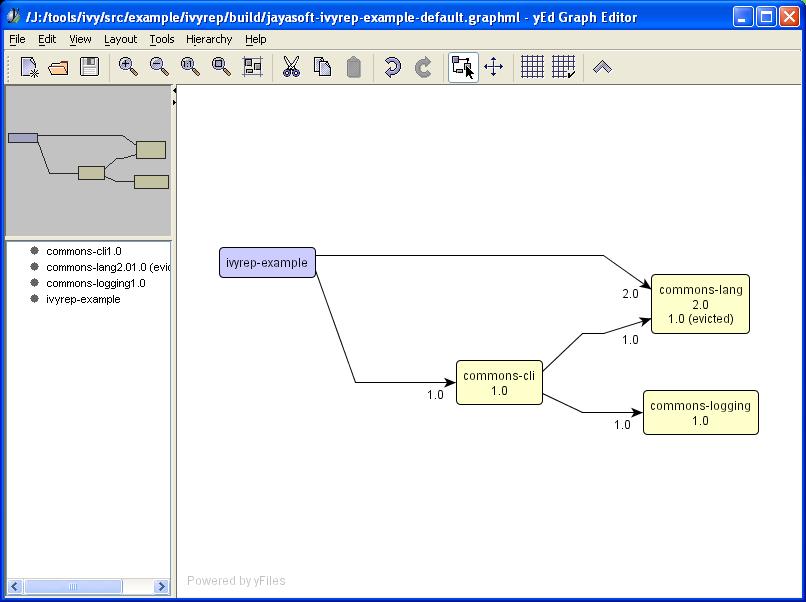
Launch yEd editor, and open the GraphML file generated by the report task. You should obtain something like this:
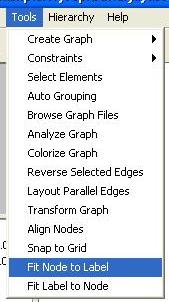
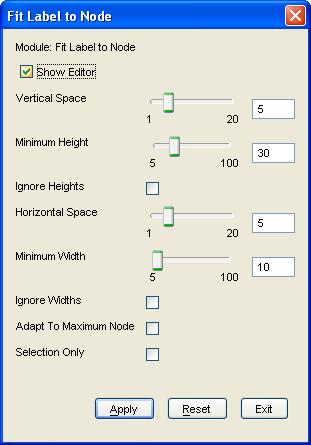
Step 2: ask yEd to adjust nodes size
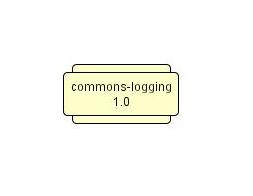
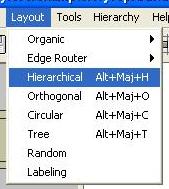
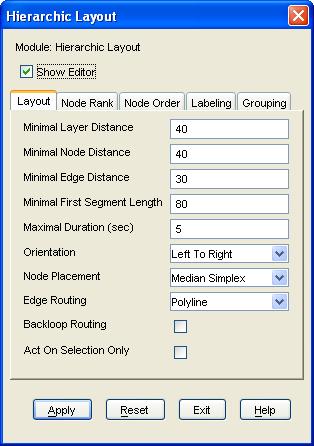
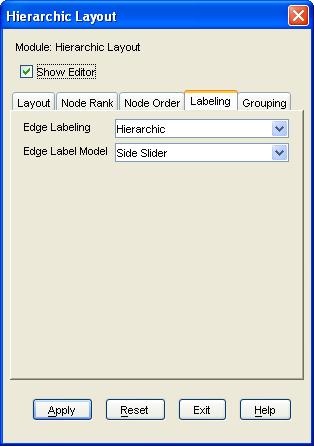
Step 3: ask yEd to layout nodes
That’s all, you should have obtained something like this:
Note that this is only one possibility, test the available layouts yourself, you could find one better in your case. Once you have laid out the graph, you can either save it with in the same file (but be warned that it will be overwritten at next Ivy report call), or another file, export it to JPEG, GIF, SVG, etc. (see yEd site for details).